Strength Tracking Guide
How to Track Strength Progression with WHOOP Strength Trainer
WHOOP recently added basic PRs and exercise trends to Strength Trainer — a genuine improvement. But it stops at the surface: no estimated 1RM line per lift, no plateau alerts, and no tie between your recovery and your output. This guide covers exactly how far WHOOP's progression view goes — and how to get the depth it doesn't.
Short answer: how do I track load and reps in WHOOP Strength Trainer?
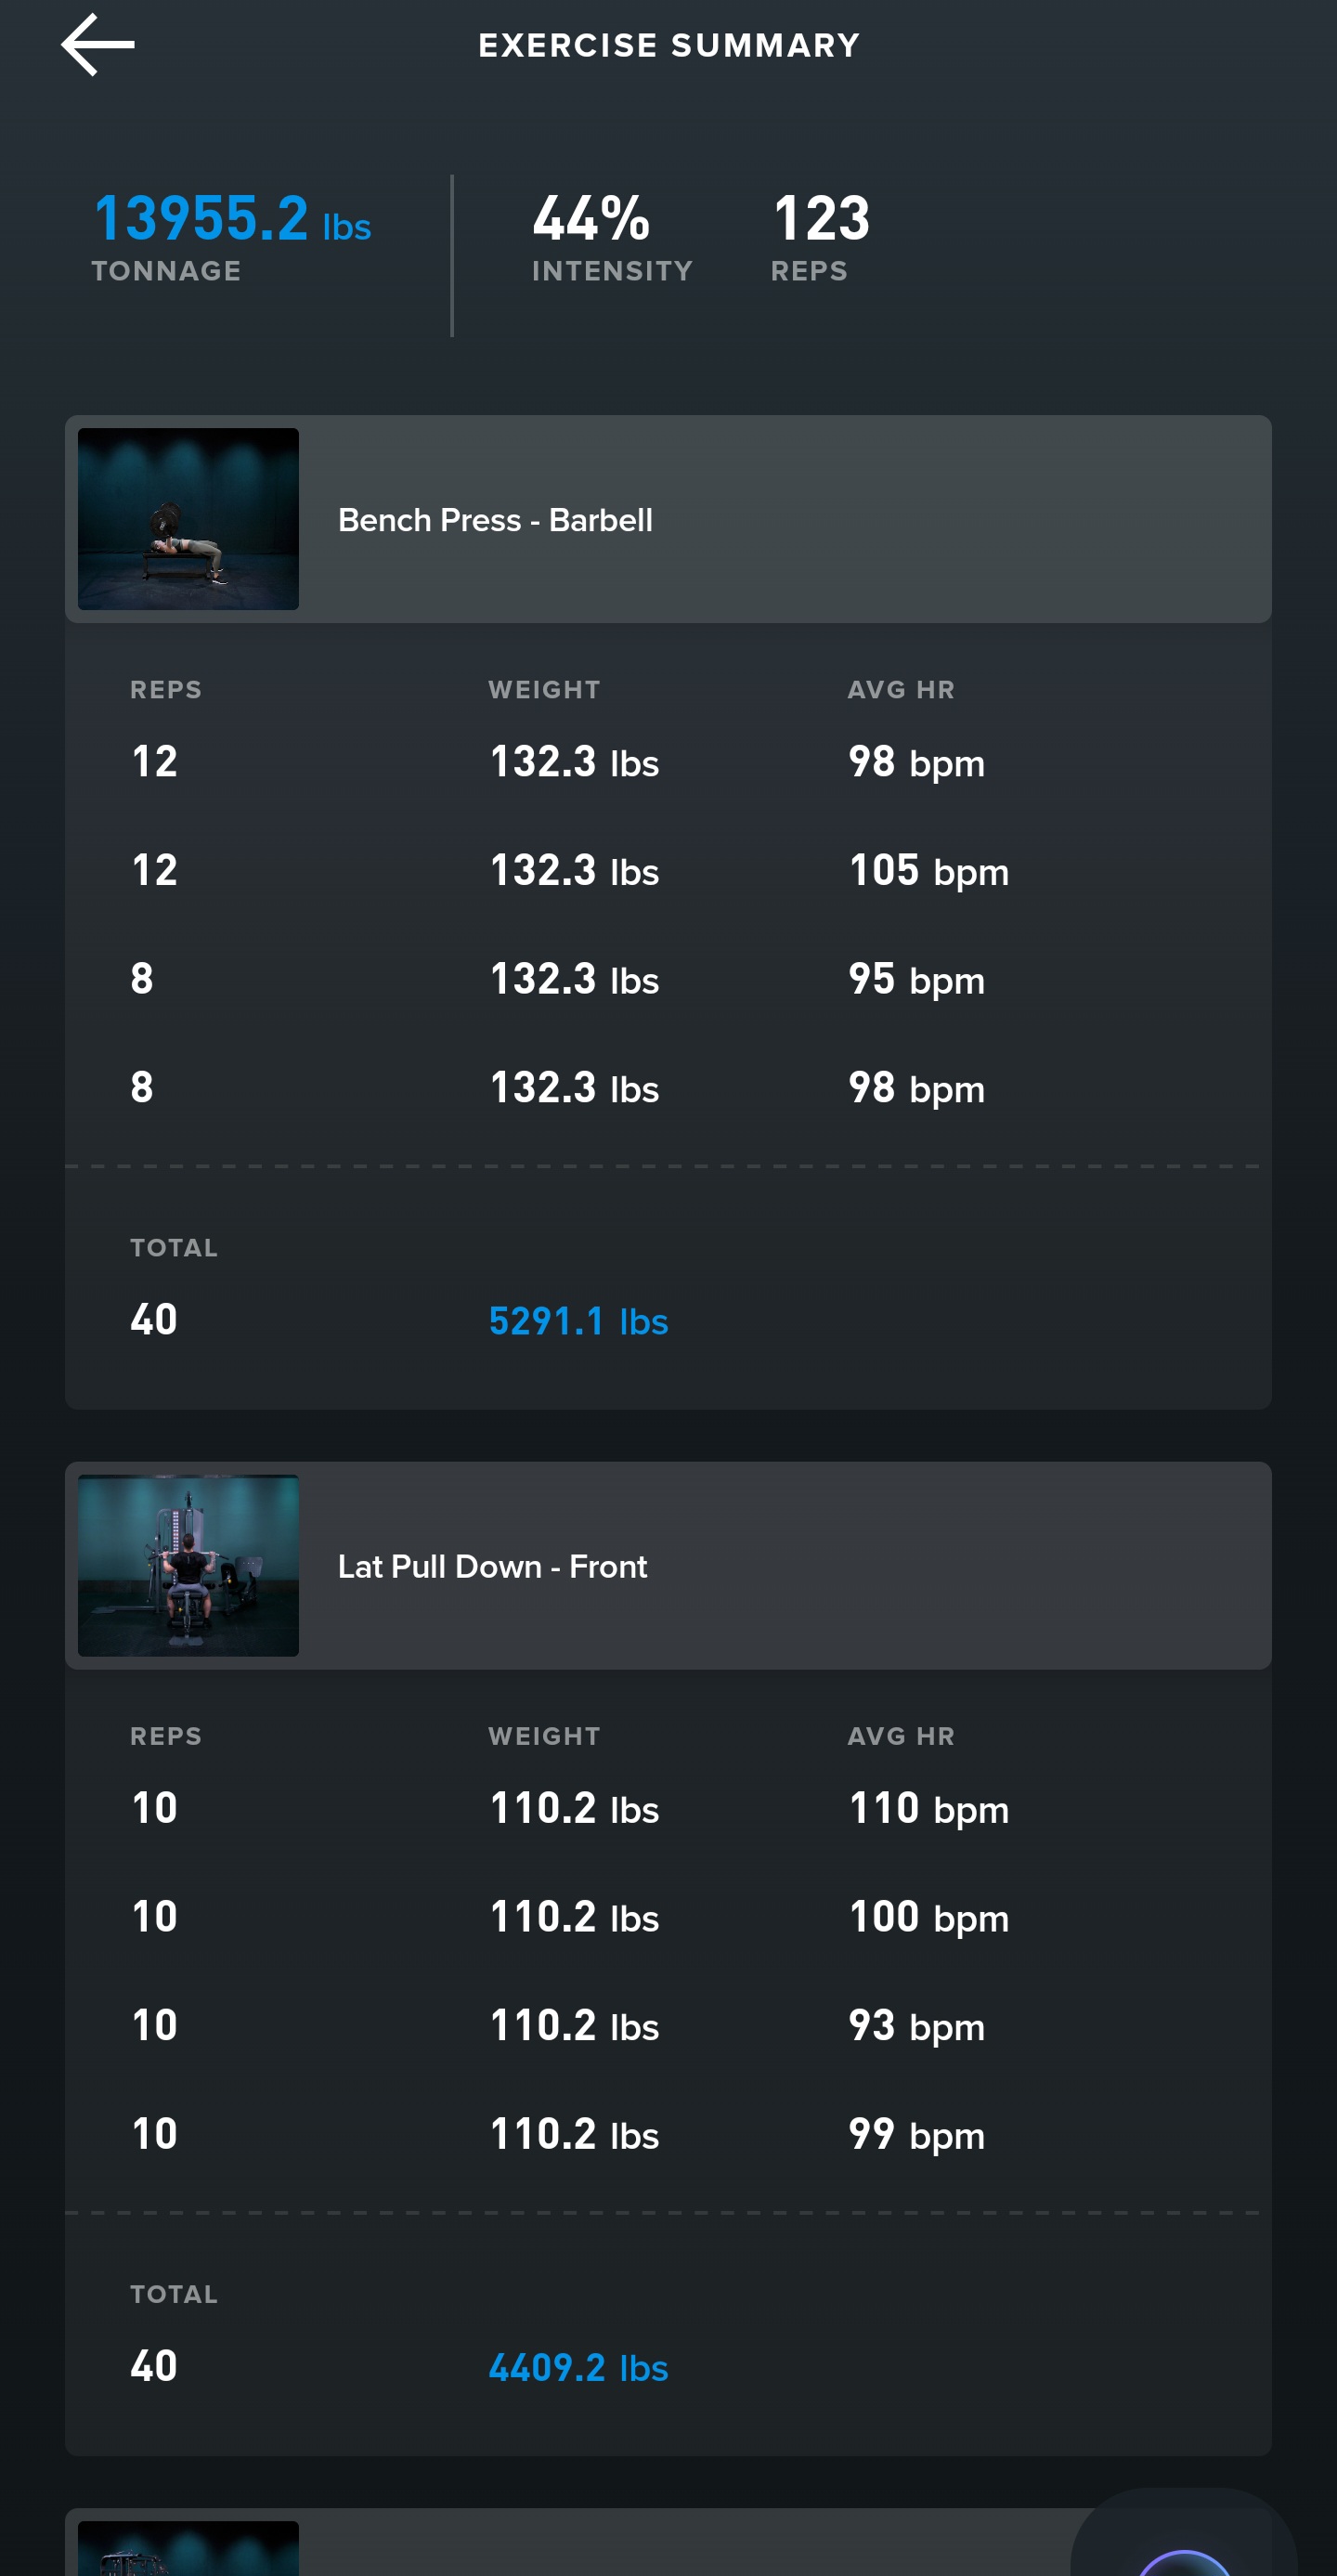
Inside WHOOP itself: log your sets, reps and weight in the Strength Trainer flow. WHOOP now also surfaces basic PRs and a simple per-exercise trend — useful, but surface-level.
To go deeper (estimated 1RM trend, plateau alerts, recovery vs output): screenshot your WHOOP Strength Trainer session and upload it to StrengthInsight. AI extracts your sets, reps and weights and builds an estimated 1RM trend per lift, five record types, plateau detection and recovery-aware insight automatically. Free, no WHOOP API needed.
Close the progression gap
Where WHOOP's Progression View Still Falls Short
- No estimated 1RM trend (Epley) per lift — the cleanest single progress signal
- No plateau detection that flags a stalled lift before it costs a training block
- No recovery-vs-output correlation — recovery and lifts stay on separate screens
- No cross-platform view tying WHOOP, Strava and your strength data together
How to fix it: upload your WHOOP Strength Trainer screenshot, let StrengthInsight extract sets/reps/weights, and see your progression instantly.
See your progression →What WHOOP Strength Trainer shows today
WHOOP does a genuinely useful job of capturing your strength sessions. After a workout, the Strength Trainer screen shows:
- A record of exercises, sets, reps, and weight (where you've entered them)
- Session-level summaries and strain scores
- Useful context alongside your recovery data and heart rate
That session-level view is great for reviewing what you just did. The problem is when you want to look further back — and further forward to verify your training is actually working.
The gap WHOOP doesn't fill
WHOOP's new exercise trends will show you a basic view — recent weights and a simple history per movement. What it doesn't do is turn that into an estimated 1RM trend line, the single cleanest read on whether a lift is genuinely improving across weeks rather than just bouncing session to session.
And it stops there. There's no alert when you've been stuck at the same effective load for four sessions in a row, no per-lift status telling you a movement is Plateauing versus Getting Stronger, and no way to see whether a flat stretch is real regression or just a low-recovery week. The depth that makes the data decision-grade isn't there yet.
→ See your progression trend automatically
This is the core gap. WHOOP is excellent at strain and recovery, but those are physiological signals — they tell you how hard a session was, not whether your bench is climbing. Real progression means seeing load, reps and volume trended across weeks, per exercise: a rising estimated 1RM line, a PR you actually hit, a lift that's been flat for a month. That's exactly what StrengthInsight builds from your screenshot — free, in about a minute.
What progression tracking actually looks like
Useful strength progression data has a few core elements. If you can see all of these for each of your main lifts, you can make genuinely informed decisions about your training:
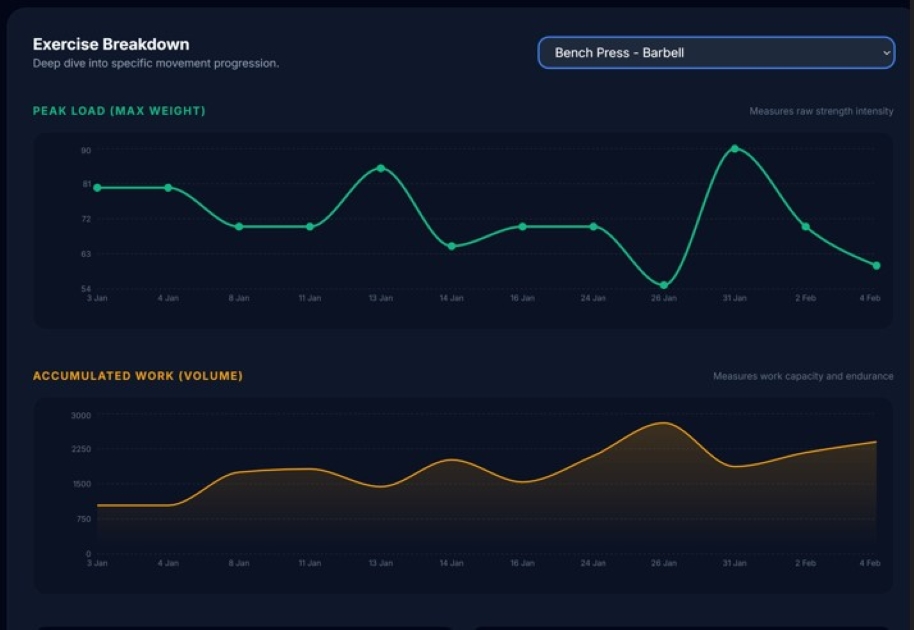
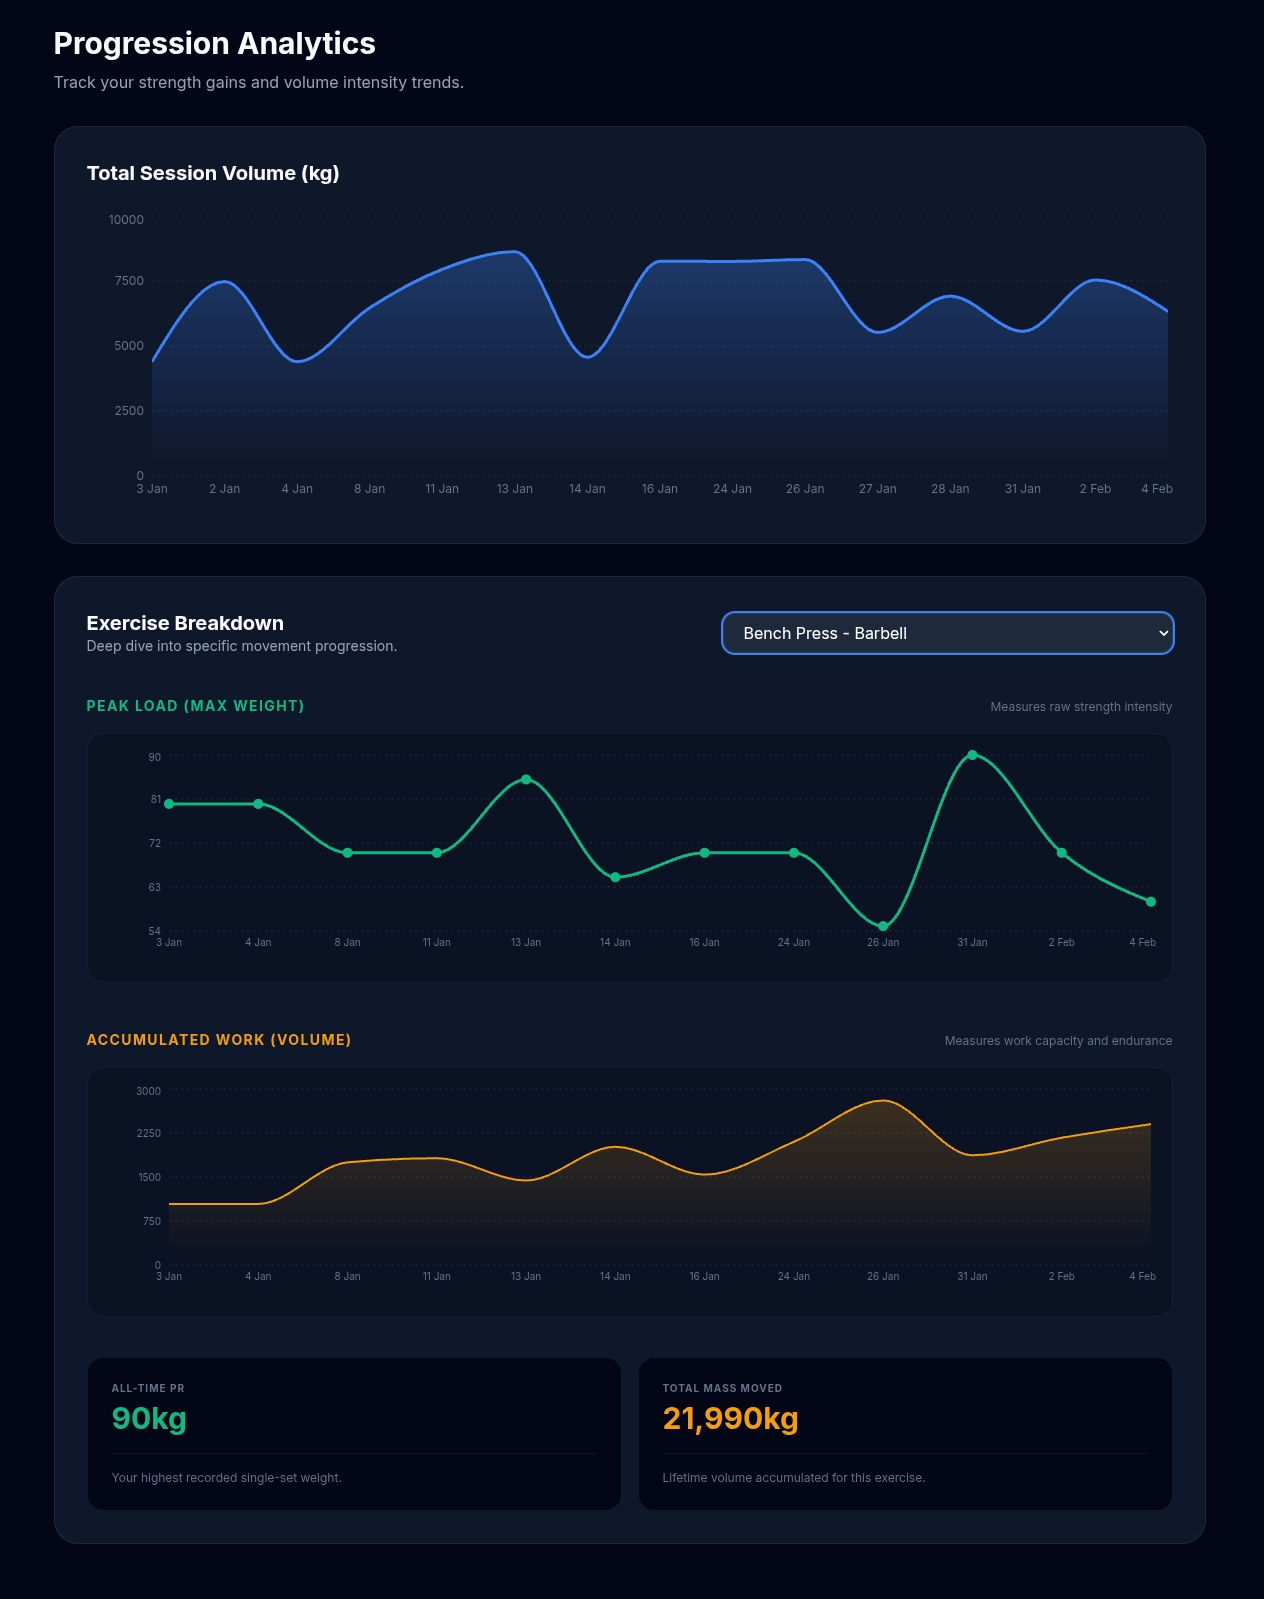
- Estimated 1RM trend over time — the best single number for tracking whether a lift is improving. Uses your best set each session (weight × reps via the Epley formula) to produce a smoothed picture of your strength. A flat line for 4+ weeks is a plateau; a rising line is progress.
- Best set per session — heaviest single set weight, tracked week to week. Simple and direct.
- Volume per session — total reps × weight for the exercise. Volume trends tell you whether you're doing more total work, even if your max load hasn't moved yet.
- Plateau detection — an alert when your peak load and volume have been within a few percent of each other for the last 4 sessions. This is the signal to change something.
Want estimated 1RM and plateau alerts, not just WHOOP's basic PRs? → Go deeper, free
To put this concretely: seeing that your bench press estimated 1RM has been flat for 4 weeks is actionable — you know you need to adjust load, volume, or recovery. Knowing your session strain was 12.3 tells you how hard you worked that day, but not whether you're getting stronger. Both matter; you just need both layers.
What StrengthInsight shows that WHOOP doesn't
StrengthInsight is a free companion tool built specifically to add the progression layer WHOOP doesn't have. Here's the direct comparison:
| Feature | WHOOP Strength Trainer | StrengthInsight |
|---|---|---|
| Session logging (sets, reps, weights) | ✓ Yes | ✓ From screenshots |
| Recovery score & HRV | ✓ Yes | ✓ Shown alongside lift data |
| Per-exercise progression trend | ~ Basic trend | ✓ Estimated 1RM (Epley) |
| Lift records (Peak Load, Top Set, Best Total) | ~ Basic | ✓ 5 record types per lift |
| PR tracking & drought counter | ~ PRs only | ✓ PRs + days-since-last-PR |
| Plateau detection | ✗ No | ✓ Auto-flagged |
| Progress labels (Stronger / Plateauing) | ✗ No | ✓ Per session |
| Weekly Performance Matrix | ✗ No | ✓ Full training view |
| AI-generated next workout | ✗ No | ✓ Recovery-aware |
Product proof
What This Looks Like in Practice
- Peak Load and Top Set Output per exercise, session by session
- Est. Max Strength (1RM) trend so you can see real direction over time
- Best Session Total and Last PR / PR drought tracking automatically
- Progress status labels: Getting Stronger, Plateauing, or Taking a Dip
- Weekly training view plus recovery-aware next workout suggestions
This turns WHOOP Strength Trainer logs into a practical progression system without API access and without manual data entry.
Upload a WHOOP workout screenshot →What the data shows over time
Most users who track consistently for 6–10 weeks start to see patterns they genuinely couldn't see before. Volume trends on compound lifts tend to be the first thing that becomes clear — you can see whether squats or deadlifts are actually getting more work week over week, or whether certain exercises are getting quietly dropped.
The plateau detection tends to fire most usefully on accessory lifts. It's easy to plateau on something like lateral raises or tricep pushdowns for weeks without noticing — because you're focused on the big compounds — and then wonder why your shoulders or arms aren't responding. A consistent log makes this visible in a way that WHOOP alone doesn't.
→ Spot plateaus before they cost another training block
For lifters who train 3–4 days a week, around 8–12 uploads gets you enough data to see a meaningful trend on your main movements. After 10 weeks you can start to see which training blocks worked and which didn't — not based on how hard your sessions felt, but on what the actual numbers did.
Why progression can look flat even when you're working hard
A few common reasons the data looks stuck, even if training is consistent:
- Missing data — if weights or reps aren't recorded in WHOOP consistently, the trend lines have gaps that make progress invisible
- Too much exercise variation — rotating exercises frequently means fewer data points per movement, so trends take longer to emerge
- No baseline comparisons — without a tool that shows "last 3 sessions vs. prior 3 sessions," a plateau can go unnoticed for weeks
- Recovery and fatigue masking performance — a bad week can look like a regression when it's just fatigue; the trend over 6–8 weeks is more reliable than any single session
This is where having both layers — WHOOP's recovery data and StrengthInsight's progression data — becomes genuinely useful. You can tell a regression from a fatigue dip because you can see both the HRV context and the lift trend at the same time.
📈 Ready to see if you're actually getting stronger?
Turn your WHOOP workouts into real progression tracking
Screenshot-based, no manual entry, and built specifically for the WHOOP Strength Trainer gap. Upload 2–3 recent sessions and get progression charts, PR tracking, and recovery-aware guidance. Free to start.
Try StrengthInsight →