Strength Data Explained
Peak Load vs Estimated 1RM vs Top Set Output: Which PR Actually Matters
Open any serious lift log and you don't get one "PR" — you get several. Peak Load, estimated 1RM, Top Set Output, Best Session Total. They all move at different times, sometimes in opposite directions, and most apps either show none of them or dump the raw numbers with no record attached. The real problem isn't motivation. It's that your data has four different "records" and nobody tells you which one to trust.
Short answer: which strength record should I track?
For trend direction, track estimated 1RM (weight × (1 + reps ÷ 30), the Epley formula, from your best set). It's the single most reliable number because it accounts for both load and reps, so it stays comparable even when your rep schemes change.
Peak Load, Top Set Output and Best Session Total are useful supporting records — but each answers a narrower question. StrengthInsight computes all four per exercise from your logged sessions, so you can see exactly which record moved and which one stalled.
Close the records gap
Your Lift Data Has Several "PRs" — And Nothing Computes Them
- Peak Load — the heaviest single-set weight you've lifted
- Estimated 1RM — your best single-rep-max estimate, the cleanest trend signal
- Top Set Output — the quality of your hardest set (weight × reps)
- Best Session Total — your record for total volume in one session
WHOOP Strength Trainer logs the sets that feed every one of these — but computes none of them. StrengthInsight surfaces all four per exercise from your screenshots.
See every record per lift →The four records hiding in your training log
Every strength session produces a handful of numbers per exercise: weight, reps, sets. From those, a few distinct "records" can be derived — and each one describes something genuinely different. The confusion comes from treating them as interchangeable. They're not. Here's what each actually measures.
Peak Load — your heaviest single set
Peak Load is the simplest record: the heaviest weight you've put on the bar for a single working set of that exercise. If your bench press history tops out at 100 kg, your Peak Load is 100 kg — regardless of whether you hit it for one rep or eight.
That last part is the catch. Peak Load is intuitive and motivating, but on its own it misleads, because it completely ignores reps. A set of 100 kg × 1 and a set of 100 kg × 6 produce the identical Peak Load — yet they represent very different levels of strength. If you grind out 100 kg for a single this week and then hit 100 kg for five next week, your Peak Load record hasn't moved an inch, even though you got dramatically stronger. Anyone tracking Peak Load alone would conclude they'd plateaued. They hadn't.
→ See Peak Load alongside reps, per exercise
Estimated 1RM — the best single trend metric
Estimated 1RM fixes exactly what Peak Load gets wrong: it folds reps into the picture. The most common version is the Epley formula:
- Estimated 1RM = weight × (1 + reps ÷ 30)
So 100 kg × 1 estimates a 1RM of 103 kg, while 100 kg × 5 estimates 117 kg. The formula takes your best set of the session — usually the one with the highest estimated value — and converts it into a single comparable strength number. That conversion is what makes it powerful for tracking: a set of 80 kg × 10 (≈107 kg) and a set of 100 kg × 2 (≈107 kg) land in the same place, so you can compare a heavy-low-rep day against a lighter-high-rep day without the numbers lying to you.
This is why estimated 1RM is the best single metric for trend direction. Because it normalises across rep ranges, the line stays meaningful even when your programming shifts from 5s to 8s to triples. A rising estimated 1RM over four to six weeks is real progress; a flat one is a genuine stall. It's an estimate, not a tested max — accuracy drifts above roughly 10–12 reps — but as a relative trend tracked against itself over time, it's the cleanest signal you have. If you want the full walkthrough of building that line, here's how to build the estimated 1RM trend from your sessions.
Top Set Output — the quality of your hardest set
Top Set Output captures the work done by your single best set: weight × reps of that set. Where estimated 1RM converts that set into a theoretical max, Top Set Output keeps it as raw output. A top set of 100 kg × 5 is an output of 500; push it to 100 kg × 6 and the output climbs to 600 even though your Peak Load didn't change.
This record is most useful when you're training in a fixed rep range and want to see whether your hardest set is getting harder — more weight, more reps, or both — without the abstraction of a formula. It's a concrete, honest measure of how much your best effort produced on a given day.
Best Session Total — your volume record
Best Session Total is the volume record: the most total work you've done for an exercise (or a whole session) in one outing, summed across every set — weight × reps, added up. Where the first three records care only about your best set, Best Session Total cares about the whole session.
It's the right record to watch when your top-end strength looks flat but you're actually doing more work overall — adding a set, hitting more reps on your back-off sets, or shortening rest. Volume often climbs before max strength does, so a rising Best Session Total can be an early sign that a strength PR is coming, even while Peak Load and estimated 1RM sit still.
Days-since-last-PR — the staleness signal
One more number ties these together: days since your last PR, sometimes called PR drought. It doesn't measure strength — it measures staleness. If none of your four records on an exercise has moved in five or six weeks, that drought counter is the flag that something in your programming, recovery, or load selection needs to change. It's the difference between "I think this lift has stalled" and a dated, specific signal you can act on. Watching the drought across exercises is one of the easiest ways to catch a plateau early before it eats a whole training block.
→ Get every record computed automatically
Side by side: which record answers which question
Each record is a tool. The mistake is reaching for the wrong one. Here's how they compare:
| Record | What it measures | Counts reps? | Best for |
|---|---|---|---|
| Peak Load | Heaviest single-set weight | ✗ No | Bragging number; absolute load ceiling |
| Estimated 1RM | Best single-rep-max estimate (Epley) | ✓ Yes | Trend direction — the best single metric |
| Top Set Output | Weight × reps of your hardest set | ✓ Yes | Quality of your best effort in a fixed rep range |
| Best Session Total | Total volume across all sets | ✓ Yes | Total workload; early sign of progress |
| Days since PR | Time since any record last moved | — N/A | Staleness signal; when to change something |
Read across that table and the hierarchy is clear. For the single question "is this lift trending up?", estimated 1RM wins because it's the only top-set record that survives changes in rep scheme. Peak Load is the eye-catching number but the most easily misread. Top Set Output and Best Session Total add resolution — the former on effort quality, the latter on total workload — and the drought counter tells you when to act.
Product proof
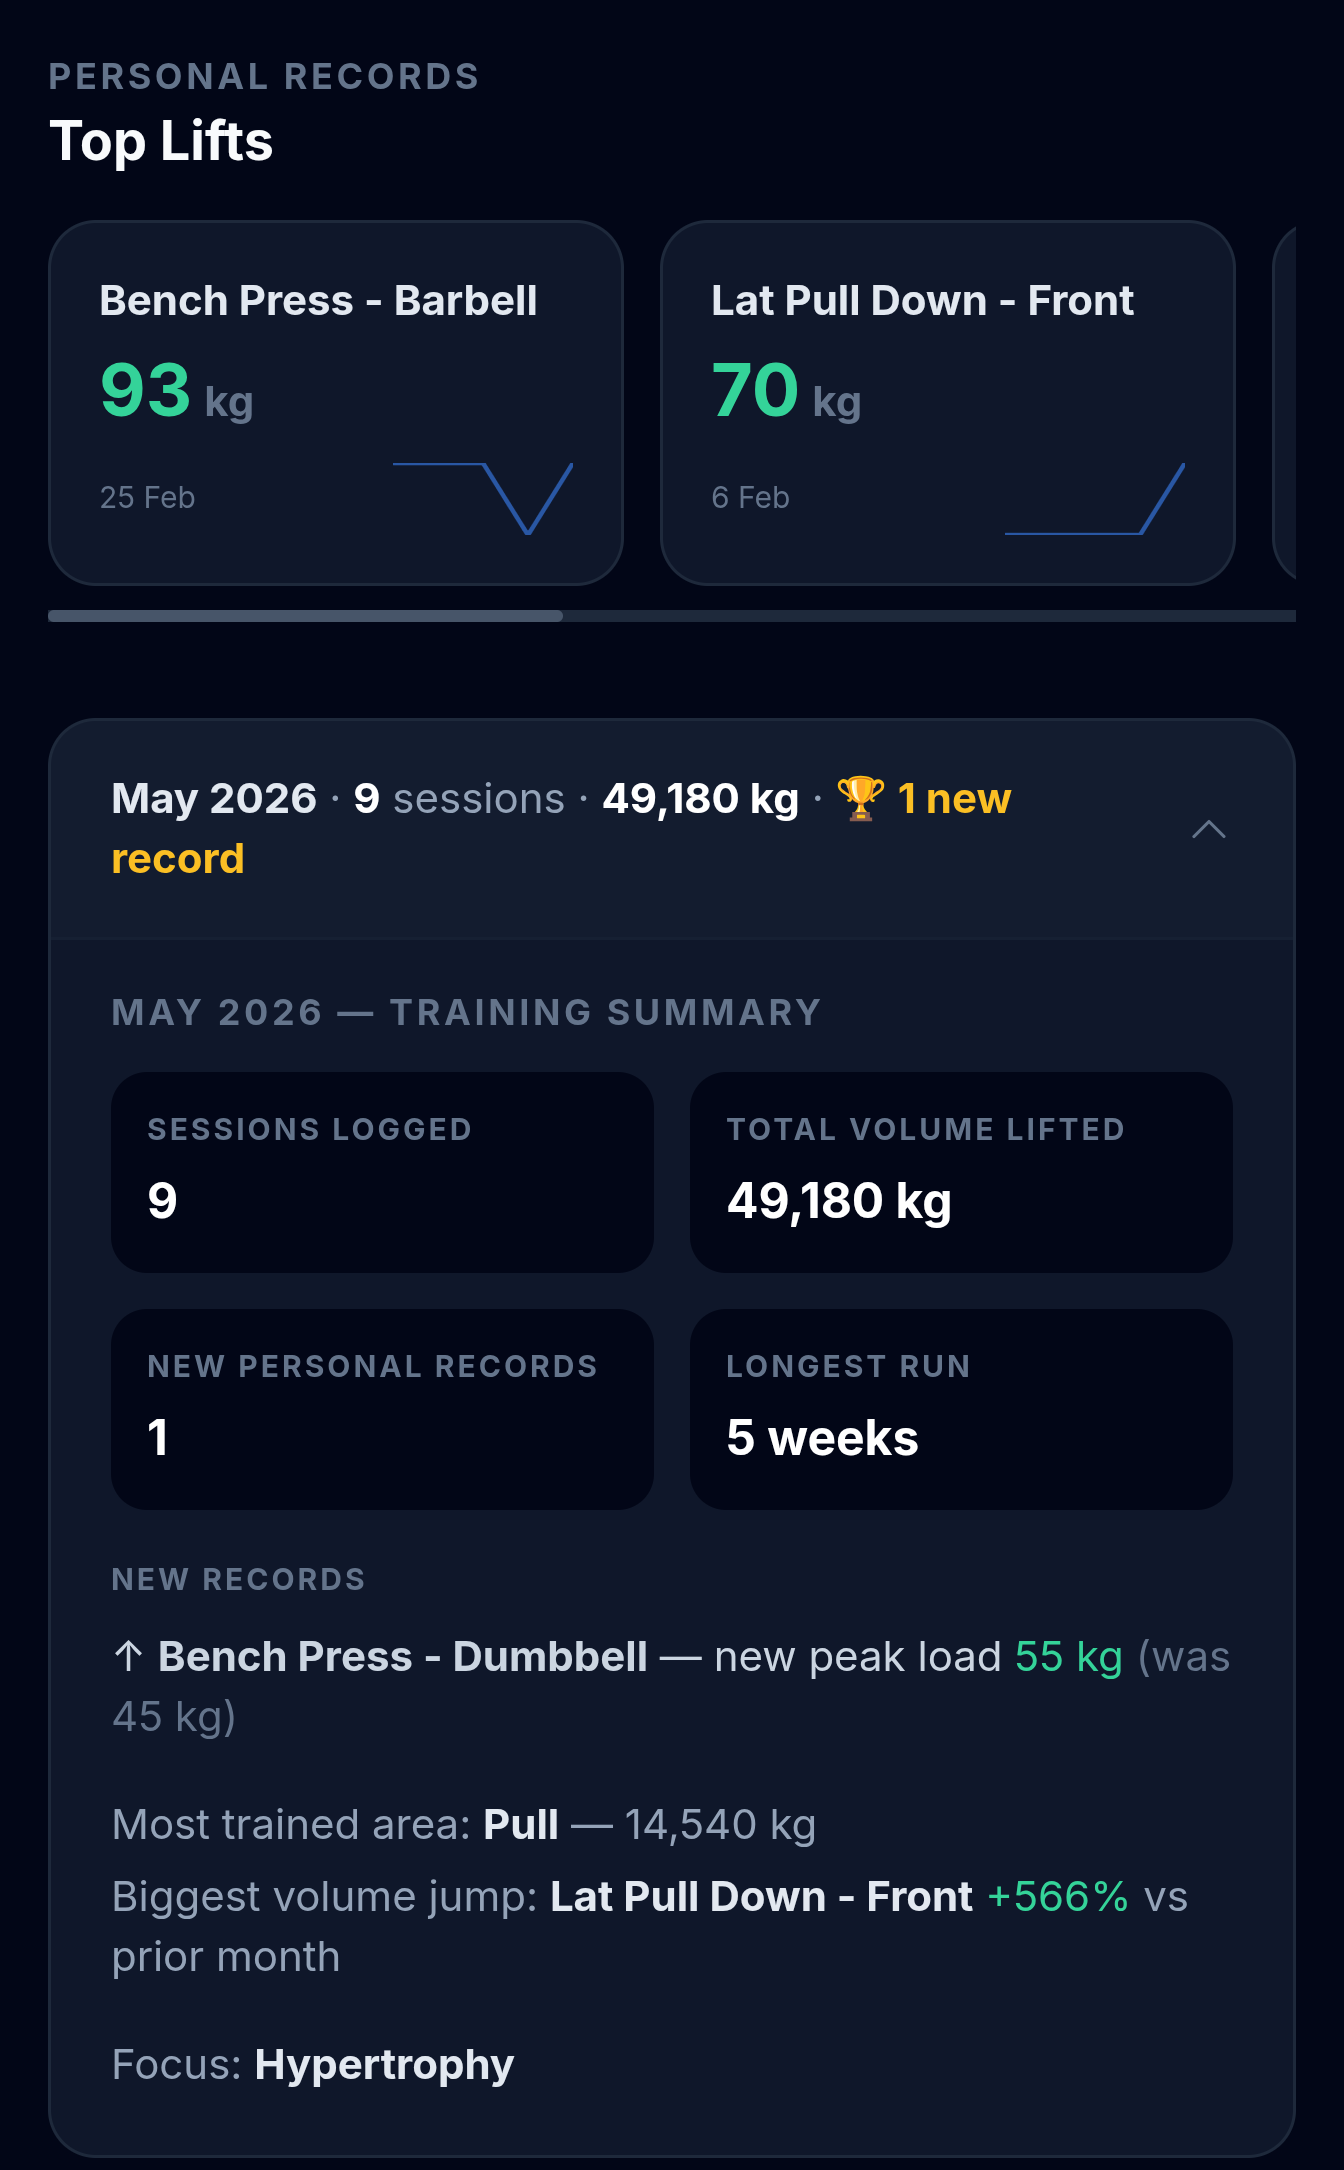
One Panel, Every Record, Per Exercise
- Peak Load and Top Set Output tracked session by session
- Estimated 1RM trend so you can see real direction over time
- Best Session Total plus days since last PR per lift
- All four computed automatically from your logged sets — no spreadsheet, no formula by hand
StrengthInsight reads the sets, reps and weights you already log and turns them into the records your tracker never computed.
See your records →
Where WHOOP Strength Trainer leaves the gap
This is exactly where the WHOOP Strength Trainer falls short. WHOOP does a genuinely good job of logging the raw material: it captures your exercises, sets, reps and weights during a session, and wraps that in strain and recovery context. The session-level summary is useful for reviewing what you just did.
But WHOOP computes none of these records. Open it after a workout and there's no Peak Load per exercise, no estimated 1RM trend, no Top Set Output, no Best Session Total, and no drought counter. The numbers that feed every record are sitting in your history — but they're never turned into the records themselves. And because WHOOP has no public API, you can't pull that data into a spreadsheet or another tool to compute them yourself. The raw sets are trapped, session by session, in a view that was built for strain — not for strength records.
So you end up with the worst version of the records gap: scattered numbers across dozens of session screens, four different records that none of them surface, and no automated way to extract the data. You're left eyeballing past sessions and trying to hold a trend in your head.
How a tool closes it
The fix is to take the data WHOOP already logged and run the math on it. That's what StrengthInsight does: screenshot a WHOOP Strength Trainer session, upload it, and AI extracts every set, rep and weight. From there it computes all four records — Peak Load, estimated 1RM (via Epley, from your best set), Top Set Output and Best Session Total — per exercise, and tracks days since your last PR on each lift. No API needed, no manual data entry, and the records update every time you add a session.
The payoff is that you stop guessing which record matters. You see the estimated 1RM line for trend direction, glance at Peak Load and Top Set Output for context, watch Best Session Total for early signs of progress, and let the drought counter flag staleness — all in one panel, per exercise, instead of scattered across session screens that compute nothing.
📊 Stop guessing which PR counts
See every strength record your tracker never computed
Peak Load, estimated 1RM, Top Set Output and Best Session Total — all computed per exercise from the sessions you already log. Screenshot-based, no API, no manual entry. Free to start.
Try StrengthInsight →