Strength Tracking Guide
How to Spot a Lifting Plateau in Your Data Before You Waste a Month
You already know what you're training for. The problem is your data won't tell you when a lift has quietly stopped moving. A plateau rarely announces itself — it hides between sessions, spread across separate logs, with no trend line to make the flat stretch obvious. By the time it feels wrong, you've often already burned three or four weeks repeating a block that wasn't working.
Catch the stall early
See a flat lift before it costs you a training block
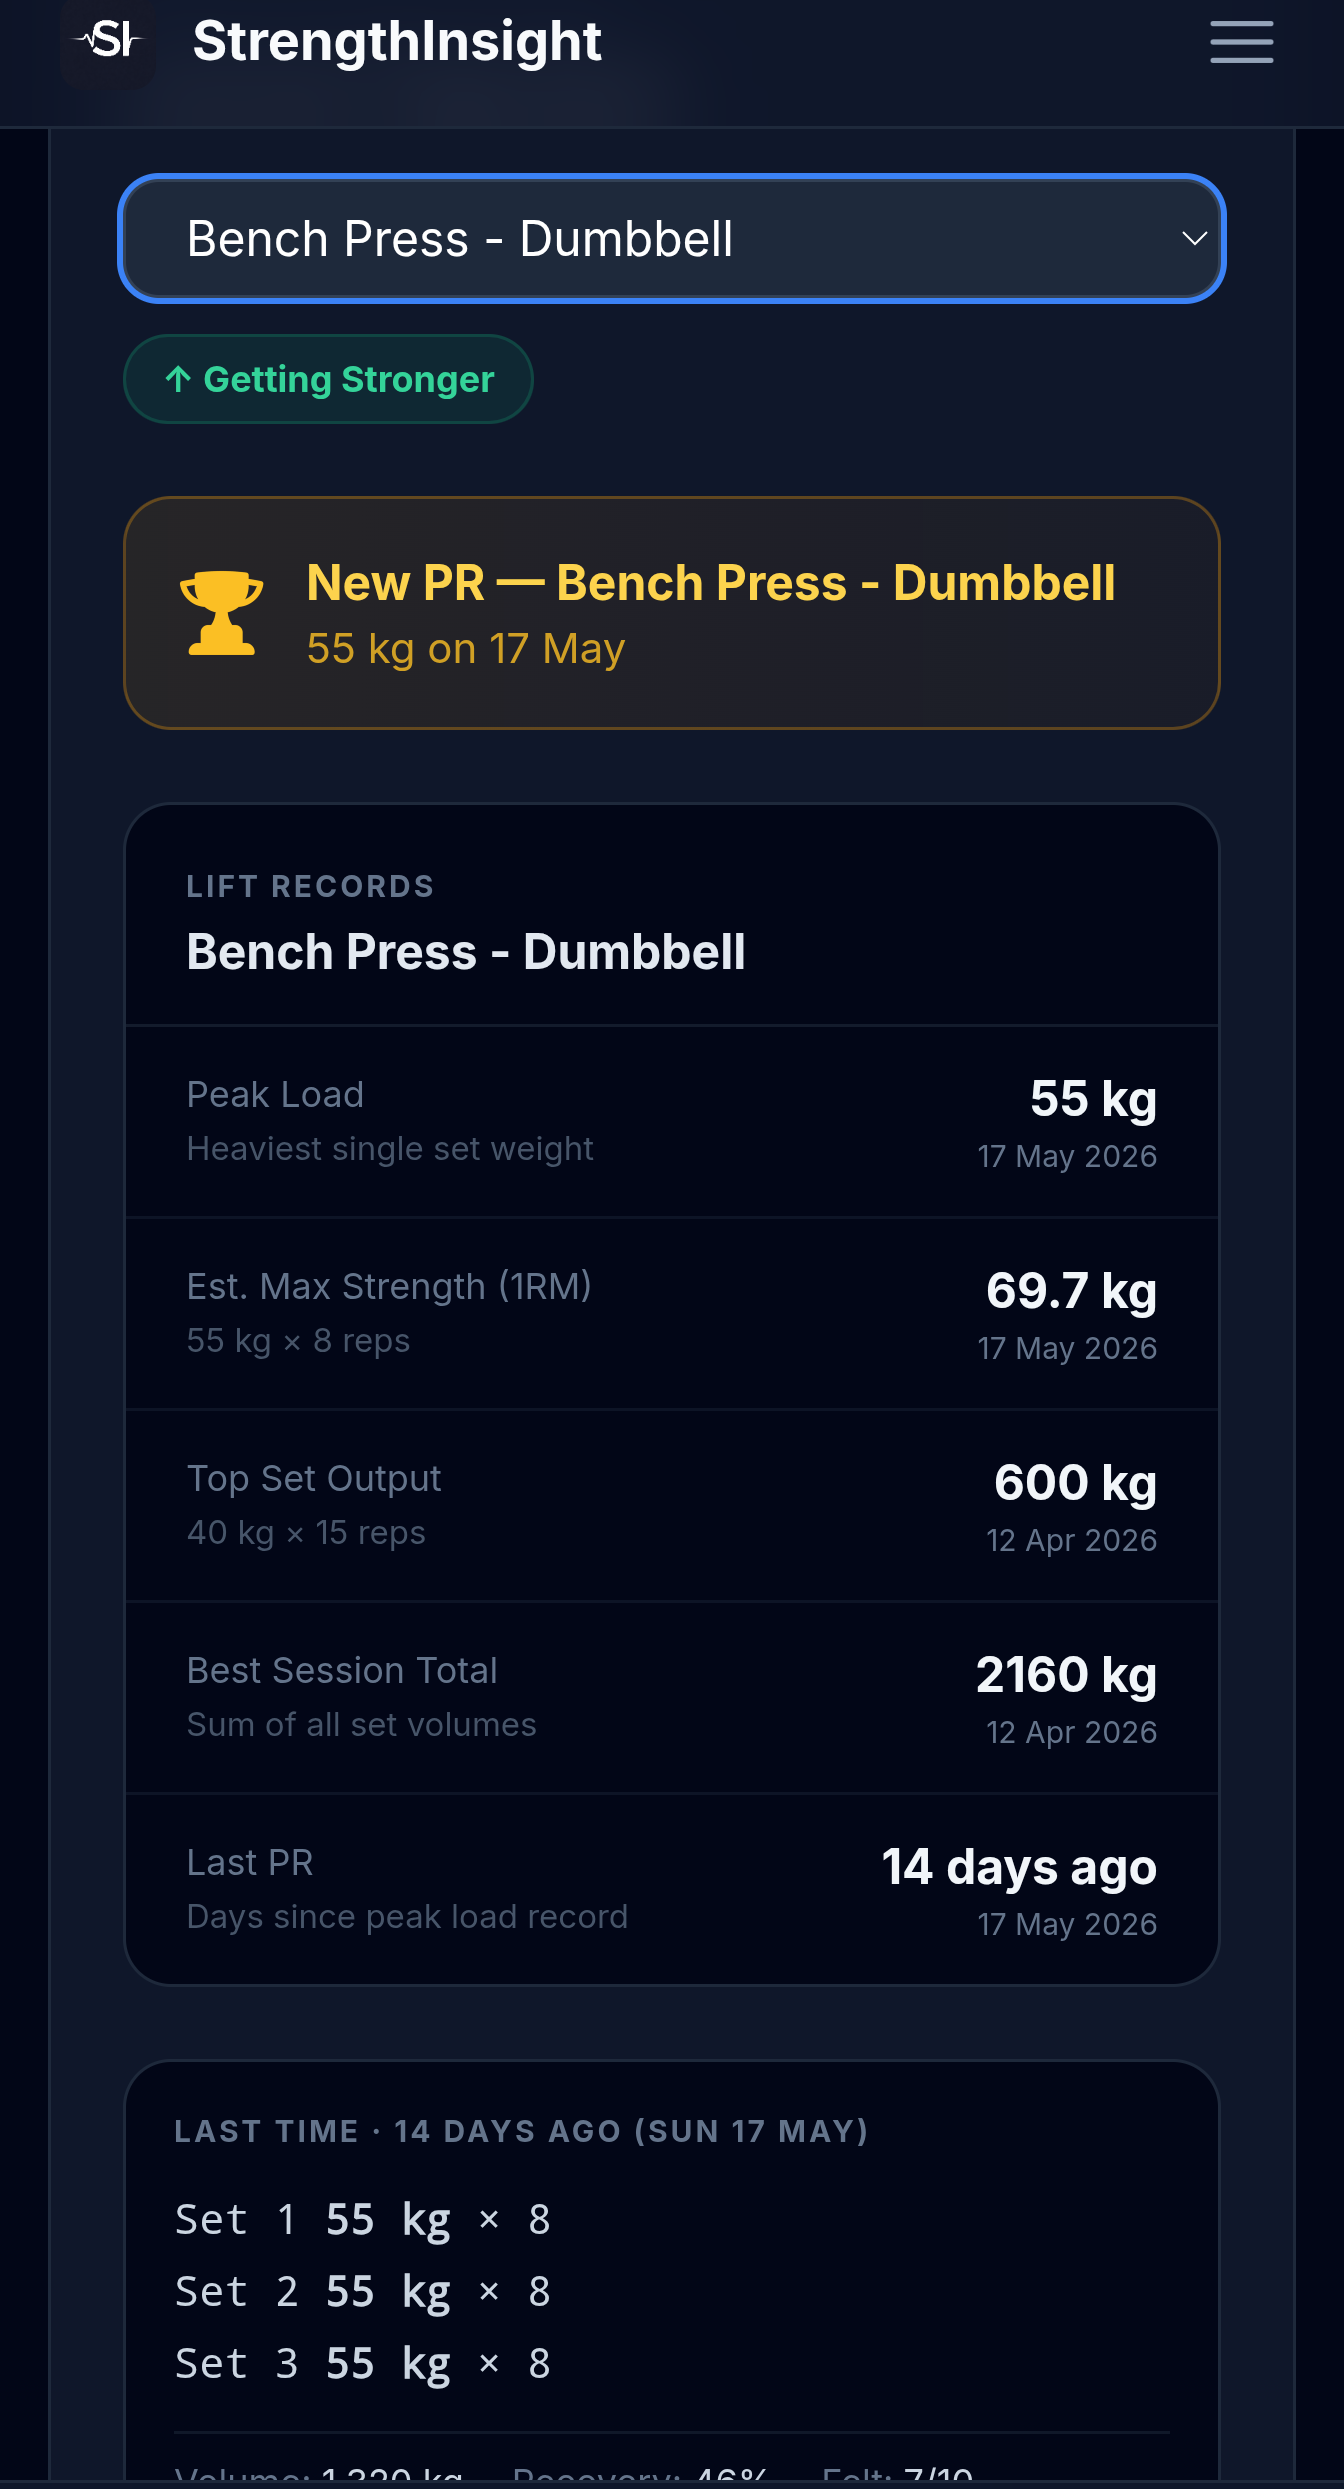
- Estimated 1RM trend per exercise — a flat line is a plateau you can actually see
- Peak load and volume tracked together, so neither stalls unnoticed
- Per-lift status labels: Getting Stronger, Plateauing, or Taking a Dip
- Works from WHOOP Strength Trainer screenshots — no API, no manual entry
Upload a few recent sessions and let StrengthInsight build the trend view your logs don't have.
Spot your plateaus →Short answer: how do I spot a plateau in my lifting data?
The data definition: a lift is plateauing when its peak load and its volume have both stayed within roughly ±3% across 4 or more sessions, and the estimated 1RM line is flat over that window.
Why it hides: session-by-session logs show one workout at a time, so a flat stretch looks like a series of "fine" sessions. You only catch it with a trend view that stacks sessions per exercise. StrengthInsight builds that view from your WHOOP screenshots and labels each lift automatically.
What a plateau actually looks like in the numbers
"Plateau" gets used loosely — one bad session, a heavy week, a missed PR. None of those is a plateau on its own. A plateau is a pattern, and patterns only show up across multiple sessions. Here's a definition you can apply to your own data:
- Flat peak load — your heaviest working set for that exercise hasn't meaningfully moved (within about ±3%) over your last 4+ sessions.
- Flat volume — total work (sets × reps × weight) for that lift has stayed in the same band over the same window. If load is flat but volume is climbing, you're not plateaued — you're building capacity. Both flat at once is the real signal.
- Flat estimated 1RM line — using your best set each session (weight × reps via the Epley formula), the smoothed strength curve stops trending up. A flat 1RM line for a month is the cleanest single indicator of a stall.
The ±3% band matters because day-to-day noise is real. Sleep, hydration, time of day, and bar grip all swing a single session by a few percent. One flat session means nothing. Four flat sessions in a row, with volume flat too, is a plateau worth acting on.
→ See which of your lifts are flat right now
Why plateaus stay invisible without a trend view
This is the core problem, and it's a data problem, not a training problem. Most logging — including WHOOP Strength Trainer — records each session as its own entry. You open the app, you see the workout you just did, and it looks fine. Reps were there. Weight was there. You moved the bar.
What you can't see, scrolling through a stack of single-session summaries, is that the bench number on the screen today is the same number from three weeks ago. The history exists — it's just buried session by session, with no line connecting the dots. Your brain doesn't hold four weeks of working-set weights in memory accurately enough to notice a 0% trend. A chart does it instantly.
That's the difference between a log and a trend view. A log answers "what did I do today?" A trend view answers "is this lift going anywhere?" Without the second one, a plateau can run for a month before it finally feels stuck — and by then you've spent the block.
Accessory lifts plateau the most — and you'll notice them last
Your attention goes to the big compounds. Squat, bench, deadlift, overhead press — those get loaded, programmed, and watched. So when they stall, you tend to catch it eventually, because you're already looking.
Accessories are where plateaus go undetected for the longest. Lateral raises, face pulls, tricep pushdowns, hamstring curls, calf work — these get the same weight and the same reps week after week almost by default, because nobody's tracking their progression. You'll spend two months wondering why your shoulders or arms aren't responding, when the answer is sitting in plain sight: that lift hasn't gotten harder since March.
A per-exercise trend view fixes this by treating every lift equally. The accessory that's been flat for six weeks gets the same flag as a stalled bench press. That's exactly the kind of stall that's invisible in a session log but obvious the moment you see a flat line next to a "Plateauing" label.
No stall alerts in your current setup? → Get a plateau flag on every lift, not just the big three
Product proof
What the trend view actually surfaces
- Estimated 1RM trend per exercise, so a flat month is impossible to miss
- Peak Load and Best Session Total tracked side by side — catches load and volume stalls
- Days since last PR, so a quiet drought becomes a number you can see
- Status labels on every lift: Getting Stronger, Plateauing, or Taking a Dip
- Built from WHOOP Strength Trainer screenshots — no API access required
This turns scattered session logs into one trend per lift, so a plateau shows up in week one of the stall — not week four.
Upload a WHOOP screenshot →What to change once you've spotted the stall
Detecting the plateau is the hard part because it's the invisible part. Once you can see it, the response is well-trodden. The point of catching it early is that you get to make these changes after one wasted week instead of four:
- Load — if your reps at a given weight are comfortably in the top of your range but the weight hasn't moved, add load and drop reps back down. The flat line is often just a missed progression step.
- Volume — if load is genuinely stuck, add a set or two per week before forcing weight. More total work can break a stall that more intensity can't, especially on accessories.
- Rep range — a lift stuck in 5×5 for a month sometimes responds to a shift into 3×8–10 (or vice versa) for a block. Changing the stimulus is often enough.
- Recovery — sometimes the lift isn't plateaued, it's under-recovered. If the trend went flat right when sleep or recovery dropped, the fix isn't programming — it's rest.
That last point is why it helps to look at strength data and recovery data together. A flat 1RM line during a stretch of poor recovery is a very different problem from a flat line during good recovery. One needs a deload; the other needs a programming change.
→ View your lift trends and recovery in one place
Where WHOOP fits — and where it stops
If you train with WHOOP Strength Trainer, you're already capturing the raw material. WHOOP logs your sets, reps, and weights during the session, and it pairs that with strain and recovery data that genuinely helps you read a flat stretch. That's a strong foundation.
What it doesn't do is connect those sessions into a per-exercise trend or flag a stall. WHOOP will happily log the same bench number four weeks running and never tell you it's flat — there's no plateau alert, no estimated 1RM line per lift, no "Plateauing" label. And because WHOOP has no public API for Strength Trainer data, you can't pipe it into a tool that does. The practical route is screenshot OCR: capture your session summary, upload it, and let the extraction build the trend automatically.
| Capability | WHOOP Strength Trainer | StrengthInsight |
|---|---|---|
| Logs sets, reps, weight | ✓ Yes | ✓ From screenshots |
| Recovery & strain context | ✓ Yes | ✓ Shown beside lifts |
| Per-exercise 1RM trend line | ✗ No | ✓ Estimated 1RM chart |
| Peak load + volume tracked together | ✗ No | ✓ Per exercise |
| Plateau / stall detection | ✗ No | ✓ Auto-flagged |
| Status labels (Stronger / Plateauing / Dip) | ✗ No | ✓ Per lift |
| Public API access | ✗ None | ✓ Screenshot OCR instead |
So WHOOP gives you the inputs and the recovery layer; the missing piece is the trend and the flag. If you want to go deeper on the single most useful metric here, it's worth learning how to build an estimated 1RM trend from your WHOOP sessions — that flat line is the clearest plateau signal you have. And if a lift dipped right when you felt run down, check whether recovery is masking a dip before you rewrite your program.
How much data you need to trust the call
A plateau is a multi-session pattern, so you need enough sessions to see one. For a lift trained once or twice a week, around 4–6 sessions of data is the minimum to distinguish a real stall from normal noise. That's typically 3–4 weeks of training. The good news: if you backfill a handful of recent WHOOP screenshots, you don't have to wait — the trend appears as soon as the data's in.
For lifters training 3–4 days a week across a few movements, 8–12 uploads gives you a clear read on which lifts are progressing and which have gone flat. The whole point is to compress the detection window. Instead of feeling stuck after a month and only then suspecting a plateau, you see the flat line forming and change the variable while there's still block left to save. That early read is the entire value of turning scattered logs into one trend per lift.
📉 Stop a plateau before it eats a month
Turn your WHOOP sessions into a per-lift trend view
Screenshot-based, no manual entry, no API needed. Upload 2–3 recent WHOOP Strength Trainer sessions and get estimated 1RM trends, peak-load and volume tracking, and a plateau flag on every lift. Free to start.
Try StrengthInsight →