Strength Data Guide
How to Build an Estimated 1RM Trend from WHOOP Strength Trainer
WHOOP Strength Trainer captures every set, rep, and weight you log. But open it up and try to draw a line through your bench press over the last two months and there's nothing to draw it from — just a stack of separate session summaries. The numbers exist. The trend line doesn't. This guide shows you how to build that estimated 1RM trend yourself, and why a smoothed line is the only honest way to read it.
Short answer: how do I build a 1RM trend from WHOOP Strength Trainer?
The method: take the best set of each session, convert it to an estimated 1RM with the Epley formula — weight × (1 + reps / 30) — then plot one point per session and smooth across them. A single session is noise; the line through 8–12 sessions is the signal.
The fast route: WHOOP exposes no Strength Trainer API, so the practical way to get your logs out is to screenshot a session and upload it to StrengthInsight. It extracts your sets, reps, and weights, computes the estimated 1RM per lift, and charts the smoothed 1RM trend WHOOP's basic view doesn't compute. Free.
Close the trend gap
WHOOP Logs Your Sets. It Never Draws the 1RM Line.
- No estimated 1RM trend for any individual lift across sessions
- No smoothed signal — just isolated, noisy session summaries
- No per-exercise records view (best estimated max, best total)
- No API — the data is trapped inside the app, session by session
How to fix it: screenshot a WHOOP Strength Trainer session, upload it, and StrengthInsight builds the estimated 1RM trend line per lift for you.
Build my 1RM trend →Why a single session is noise, not a trend
Here is the core problem. WHOOP Strength Trainer gives you an excellent record of what happened in one workout: the exercises, the sets, the reps, the load. But strength is not a single number on a single day. Whether you actually moved a lift forward only shows up across weeks.
Any individual session is heavily distorted by things that have nothing to do with your strength: how you slept, whether you ate, your last rest day, caffeine, ambient temperature, even your mood. One session where you hit 100 kg for 5 and another where you hit 100 kg for 4 does not mean you got weaker. It means Tuesday was Tuesday.
That's why the raw WHOOP session log, however accurate, can't answer the question you actually care about. You don't need another snapshot of one workout. You need a line through many of them — and WHOOP doesn't draw one.
The Epley formula: turning a set into one comparable number
To draw a trend you first need one number per session that's directly comparable to every other session. The problem is that your sets vary — 80 kg × 8 one week, 90 kg × 4 the next. Is that progress? You can't eyeball it.
The standard fix is to convert each set into an estimated one-rep max (1RM): the load you could theoretically lift once. The most widely used estimate is the Epley formula:
- Estimated 1RM = weight × (1 + reps / 30)
So 80 kg × 8 reps estimates to 80 × (1 + 8/30) ≈ 101 kg. And 90 kg × 4 reps estimates to 90 × (1 + 4/30) ≈ 102 kg. Now they're comparable — and you can see those two sessions were essentially equal, even though the weights and reps looked nothing alike. That single comparable number is what makes a trend line possible at all.
A practical rule: the estimate is most reliable in the 1–10 rep range and drifts upward at very high reps, so use your best working set of the session — usually a heavy set of 3–8 — not a burnout set of 20.
→ Skip the math — let StrengthInsight compute the estimated 1RM from your screenshot
Best set per session: one point on the chart
For each session and each lift, you take the single set with the highest estimated 1RM and use that as the session's data point. Why the best set and not an average? Because the best set best reflects your top-end capacity that day, while the warm-ups and back-off sets are doing other jobs (technique, volume, fatigue management) and would only muddy the signal.
One session gives you one dot. Eight to twelve sessions give you a scatter of dots — and now you can finally draw a line through them. That line is the estimated 1RM trend, and it is the single most useful view in all of strength tracking. It is also exactly the view WHOOP Strength Trainer does not build.
How to read a rising vs. flat 1RM line
Once you have the line, reading it is straightforward — and far more honest than reacting to any single workout:
- Rising line — your estimated 1RM is trending up across sessions. The programming is working. Don't change anything that's working; keep progressing the load.
- Flat line for 4+ sessions — your top-end strength on that lift has stalled. This is a plateau, and it's the signal to change a variable: load, rep scheme, volume, or recovery.
- Falling line — usually fatigue or a deload, not true regression, if it's a short dip against an otherwise rising trend. A sustained decline across many sessions is the one that matters.
- Noisy zig-zag with no direction — normal session-to-session variance. This is precisely why you look at the smoothed line and not the individual dots.
The key discipline is to read the line, not the last dot. A bad single session sitting below a rising trend is fatigue. A whole run of sessions bending flat is a plateau. WHOOP shows you the dots; the trend is what tells you which of those two things is actually happening.
Product proof
What the Trend Looks Like in Practice
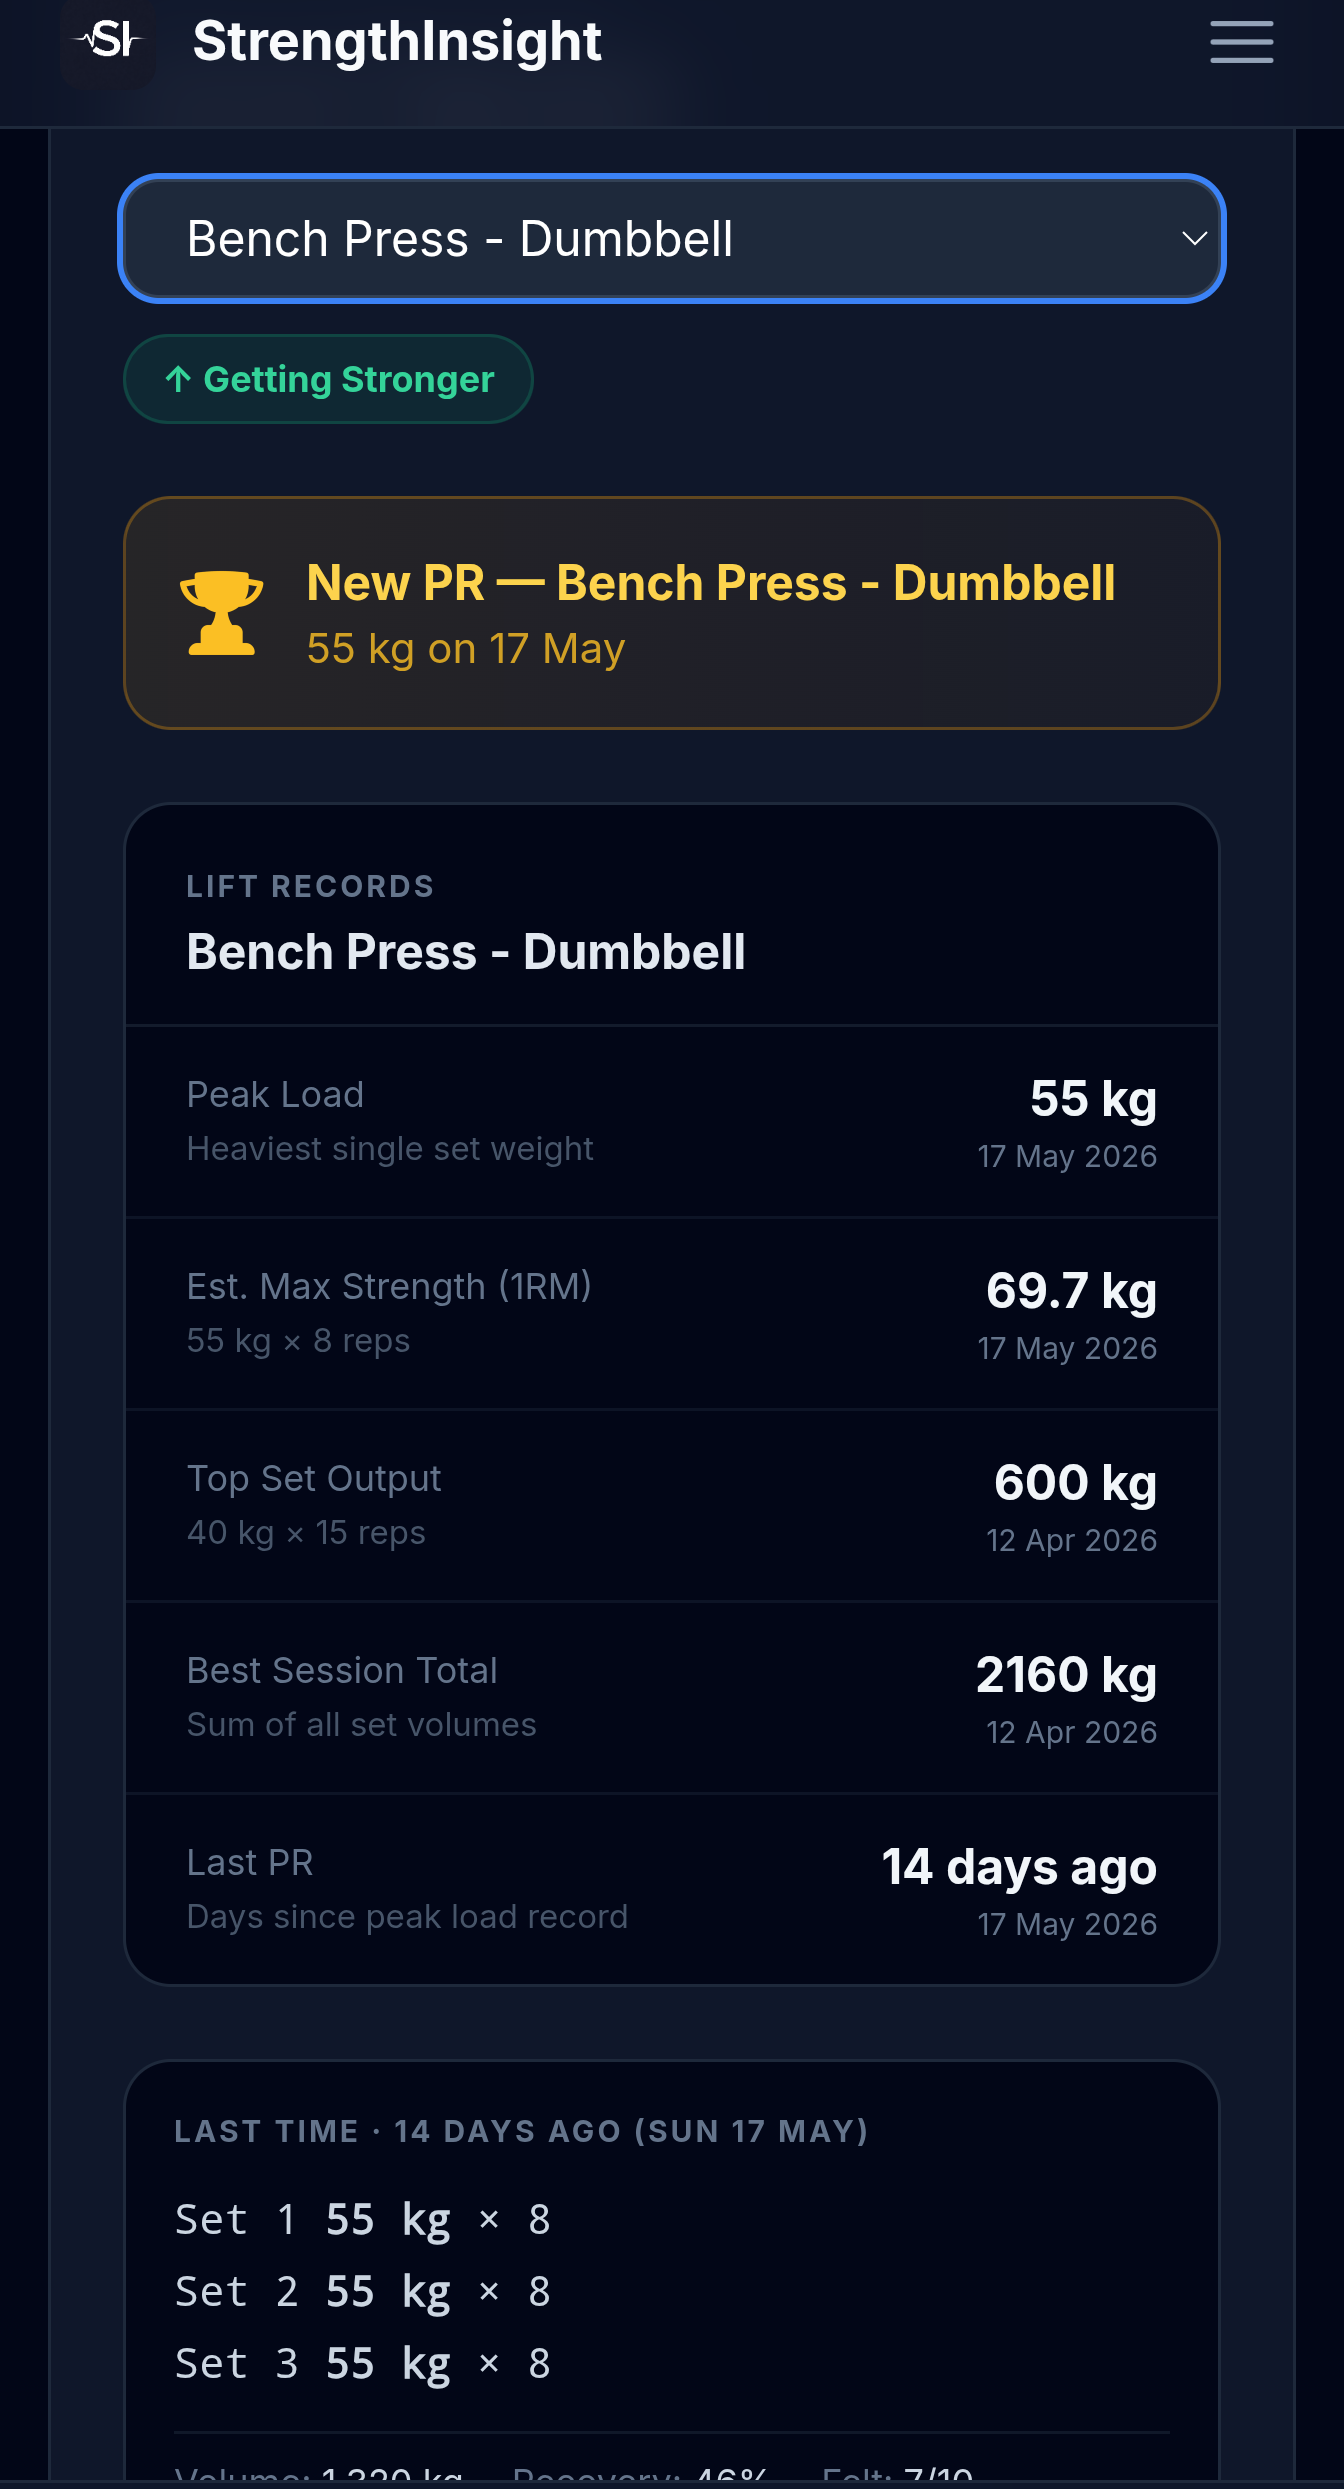
- Estimated Max Strength (1RM) trend per lift, computed via Epley on your best set
- Smoothed line across sessions so a single bad day doesn't read as a plateau
- Per-exercise records — best estimated 1RM, best session total, last PR
- Progress status labels: Getting Stronger, Plateauing, or Taking a Dip
- All built from WHOOP screenshots — no API, no manual data entry
This turns a stack of WHOOP Strength Trainer session logs into the single trend line that tells you where each lift is heading.
Upload a WHOOP screenshot →Why 8–12 sessions is the minimum for a meaningful trend
Two or three sessions is not a trend — it's three dots, and you can draw any line you like through three dots. Because each session carries real day-to-day noise, you need enough points for the underlying direction to overwhelm the variance.
In practice, 8–12 sessions per lift is the sweet spot. For a lifter training a movement once or twice a week, that's roughly 6–10 weeks of data. By then a genuine trend has separated itself from the noise: a rising line stays rising across a dip, and a flat line stays flat even after a good day. Below that count, you're mostly looking at randomness and risk reacting to a single fluke session — exactly the trap the trend line is meant to save you from.
This also explains why frequent exercise rotation hurts you here. If you swap movements every week, no single lift ever accumulates enough points to form a trend. Anchoring your main lifts and logging them consistently is what makes the line readable.
→ See how many sessions you've logged per lift — and where each trend is heading
Why screenshot OCR is the practical route out of WHOOP
You might assume you can just export your Strength Trainer data and run the math yourself. Here's the catch: WHOOP exposes no Strength Trainer API. The recovery and strain side of WHOOP has a developer API, but the per-set strength logging — exercises, reps, weights — is not available to pull programmatically. Your sets are effectively trapped inside the app, viewable session by session and nowhere else.
That leaves one practical route: read the data straight off the screen. You screenshot a Strength Trainer session summary, and OCR extracts the exercises, sets, reps, and weights from the image. It's not a hack — it's the only reliable way to get structured strength data out of WHOOP today, and it works regardless of whether WHOOP ever ships an API.
Once the sets are extracted, the rest is exactly the method above: compute the Epley estimated 1RM for the best set, store one point per session per lift, and draw the smoothed line. That's the whole pipeline — and it's what StrengthInsight automates so you don't have to maintain a spreadsheet by hand.
WHOOP vs. a real 1RM trend, side by side
To make the gap concrete, here's what the WHOOP session log gives you versus what the estimated 1RM trend gives you:
| Capability | WHOOP Strength Trainer | Estimated 1RM trend (StrengthInsight) |
|---|---|---|
| Per-session set / rep / weight log | ✓ Yes | ✓ From screenshots |
| Estimated 1RM per best set (Epley) | ✗ No | ✓ Computed automatically |
| Smoothed trend line across sessions | ✗ No | ✓ Per lift |
| Rising / flat / dip read at a glance | ✗ No | ✓ Status labels |
| Per-exercise records (best 1RM, best total) | ✗ No | ✓ Tracked |
| Programmatic export / API | ✗ None for strength | ✓ OCR extraction |
Putting it together
The estimated 1RM trend is the line that turns a pile of WHOOP sessions into a direction. Take the best set of each session, convert it with Epley, plot one point per session, smooth across at least 8–12 of them, and read the line rather than the last dot. Rising means keep going; flat for four-plus sessions means change a variable.
WHOOP gives you the raw material plus a basic trend — accurate session logs, but no estimated 1RM line and no API. The work that's left is the 1RM conversion, the smoothing, and the per-lift charting, and that's exactly the layer StrengthInsight adds for free on top of your existing WHOOP logs. If you want to go deeper on the surrounding decisions, it's worth learning to spot a plateau in your data and understanding which PR actually matters once your trend line is up and running.
📈 Ready to draw the line WHOOP won't?
Turn your WHOOP session logs into a real estimated 1RM trend
Screenshot-based, no API required, and built specifically for the WHOOP Strength Trainer trend gap. Upload a few recent sessions and get the smoothed estimated 1RM line, per-lift records, and progress status automatically. Free to start.
Try StrengthInsight →