Sleep & Recovery Data
What Bedtime Consistency and Time in Bed Do to Your Training Data
WHOOP measures your sleep in remarkable detail — when you went to bed, how long you stayed there, how efficiently you slept, your HRV the next morning. It also logs your strength sessions. But those two streams of data live in separate rooms. WHOOP never tells you which sleep signal is actually moving your recovery, or whether any of it shows up in your lift output. The numbers sit there, unconnected.
Short answer: do bedtime consistency and time in bed affect my training data?
In your own data, often yes — but the relationship is individual. Bedtime variability (how much the clock-time you fall asleep swings night to night), total time in bed, and sleep efficiency all feed into your next-day recovery, and recovery in turn frames how your sessions tend to go.
The catch: WHOOP tracks every one of those metrics but never ties them to your strength performance. StrengthInsight joins your WHOOP recovery and sleep data to your Strength Trainer lifts by date, then runs a driver analysis to surface which sleep signal correlates most strongly with your recovery and output — with the sample size and correlation behind it.
Close the data gap
The Sleep Metrics WHOOP Tracks But Never Connects to Your Lifts
- No view tying bedtime variability to your next-day HRV or recovery
- No link between time in bed and how your sessions actually went
- No driver analysis ranking which sleep signal matters most for you
- Sleep efficiency, debt, and duration sitting unused next to your lift log
How to close it: connect WHOOP recovery and sleep, add your Strength Trainer screenshots, and let StrengthInsight join them by date and show you the strongest drivers in your own data.
See your sleep drivers →The three sleep signals that matter most
WHOOP captures dozens of sleep data points, but three tend to carry the most weight when you're trying to understand recovery and training:
- Bedtime consistency (bedtime variability) — how much the time you fall asleep swings from night to night. A bedtime that lands at 10:45pm one night and 1:30am the next is highly variable; one that holds within a 20-minute window is consistent. Variability disrupts your circadian rhythm, and your body tends to read that as a stressor.
- Time in bed — the total window between getting into bed and getting out. It's the ceiling on how much sleep you can actually get. You can have great sleep efficiency and still be under-slept simply because you didn't give yourself enough time in bed.
- Sleep efficiency — the percentage of time in bed you spent actually asleep. High efficiency (typically 85%+) means you fall asleep quickly and stay asleep; low efficiency points to fragmented, restless nights.
WHOOP shows each of these clearly on its own screens. What it doesn't do is tell you which one is the lever in your data — or whether moving it shows up in your lifts at all.
Why WHOOP tracks these but never ties them to your lifts
WHOOP is built around two strong layers. There's the physiological layer — sleep, HRV, resting heart rate, recovery score — which is genuinely excellent and exposed through the WHOOP API. And there's the Strength Trainer layer, where you log sets, reps, and weights during a session.
The problem is that nothing inside WHOOP joins those two layers into a single analysis. You can see your recovery was 41% this morning. You can separately see that you trained chest. But WHOOP won't tell you whether your low-recovery days line up with weaker top sets, or whether the nights you protected your time in bed produced your better sessions. There's no driver view that ranks your sleep inputs by how strongly each one tracks with an outcome.
→ See which sleep signal drives your recovery
That's the data gap. The signals are all being measured. They're just never put in the same chart as your output, so the relationships stay invisible — even after months of wearing the band.
What a driver analysis actually does
A driver analysis is straightforward in principle: take one outcome you care about, line up the candidate inputs that might explain it, and measure how strongly each input correlates with that outcome across all your matched days. The input with the strongest, most consistent relationship is your top driver.
Here's the part that matters most — these results are individual to each person. Two lifters can wear the same band, train the same split, and still have completely different top drivers. To make this concrete, here are two example findings of the kind a driver analysis can surface (your own numbers will differ):
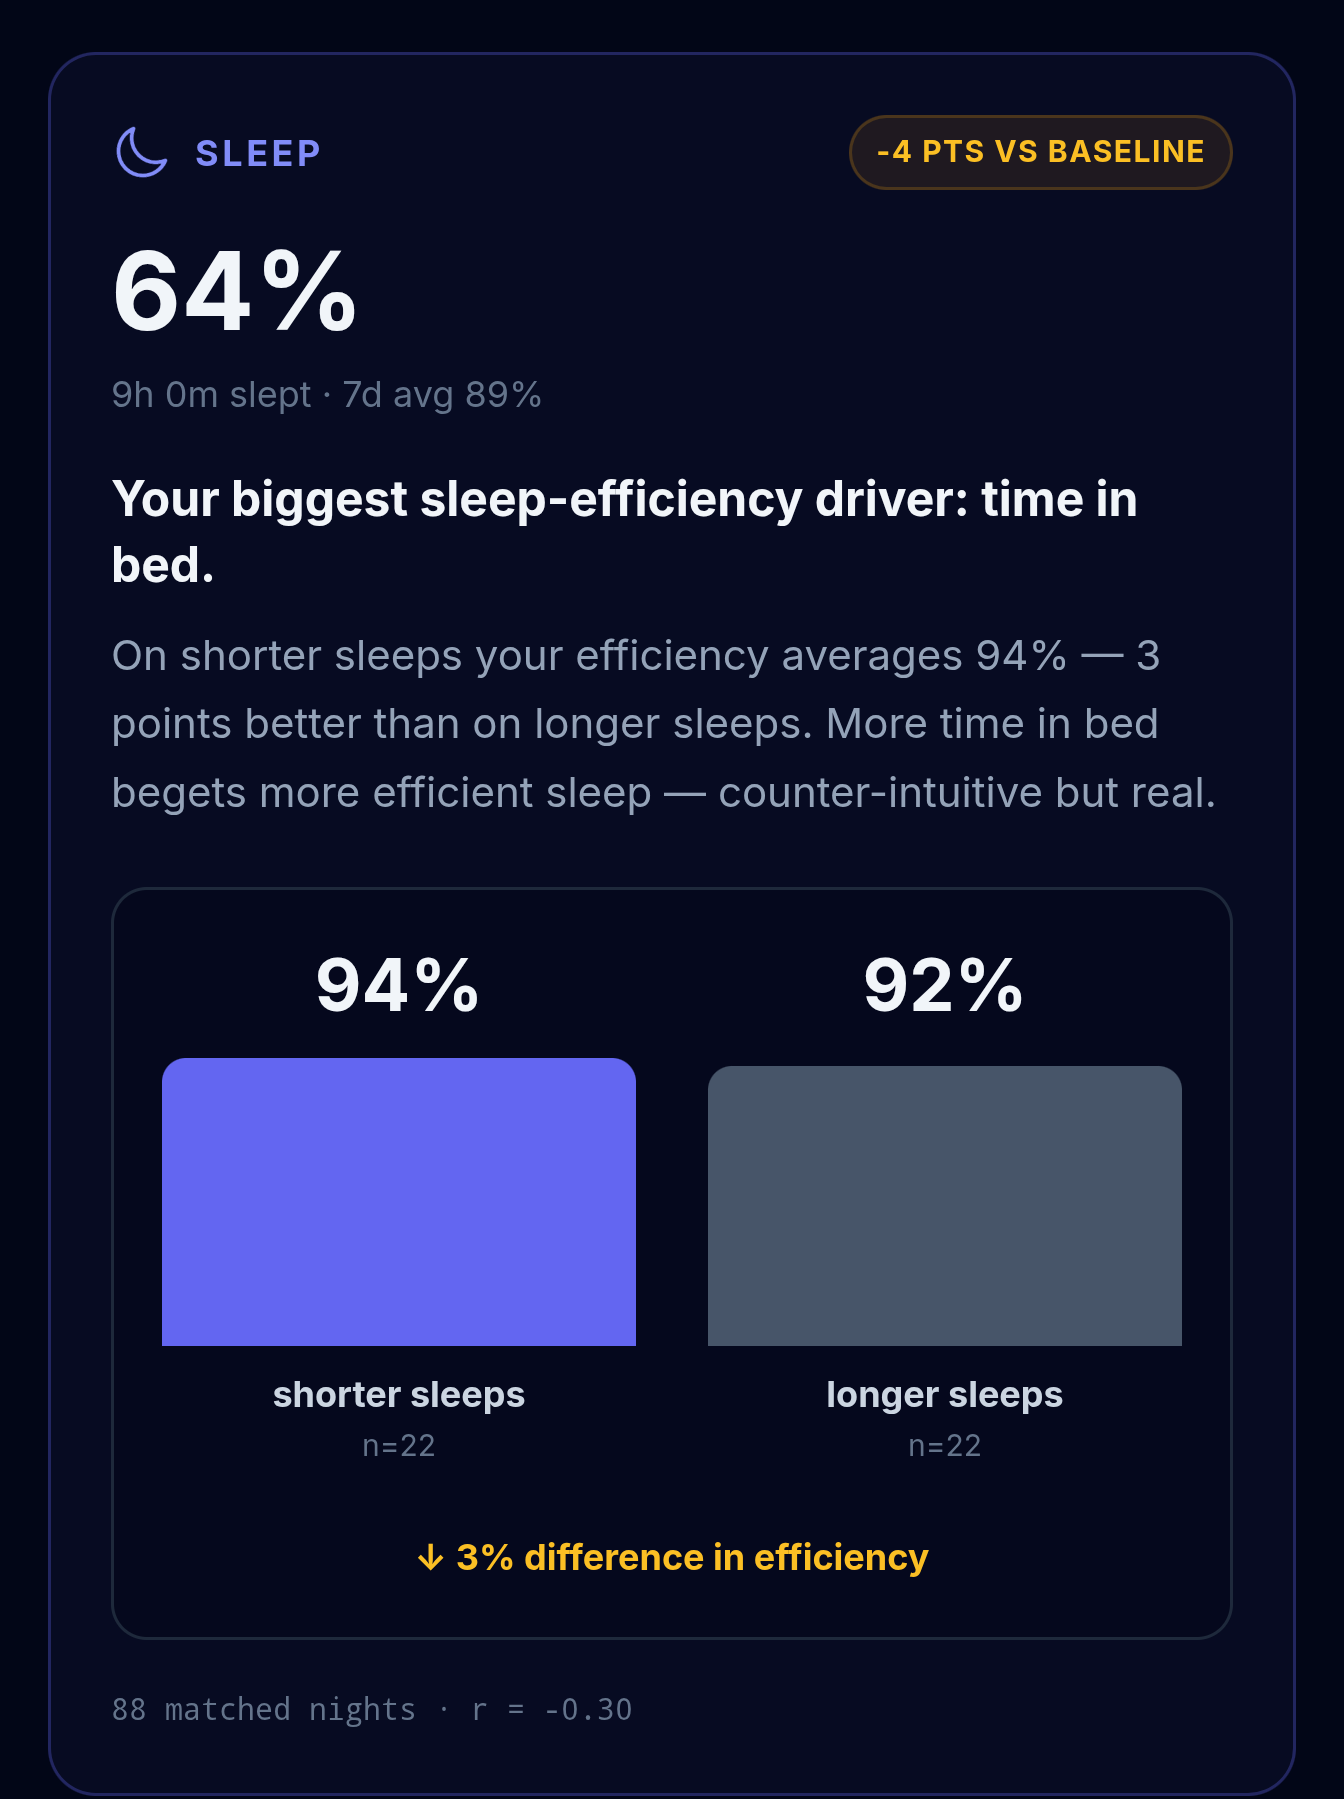
- Sleep efficiency's strongest driver is time in bed. Across, say, 58 matched nights, time in bed shows a correlation of around r = 0.61 with sleep efficiency — meaning the nights this person gave themselves a longer window were also the nights they slept more soundly. The practical read: protecting time in bed, not chasing efficiency tricks, is the lever.
- HRV's strongest driver is bedtime variability. Across 47 matched days, bedtime variability shows a correlation of around r = -0.54 with next-morning HRV — the more this person's bedtime swung, the lower their HRV tended to be. The practical read: anchoring a consistent bedtime is the lever for recovery here.
A note on honesty: correlation is not causation. A strong correlation tells you two things move together in your data, not that one strictly causes the other — there can always be a third factor (travel, alcohol, stress) moving both. The value is in spotting which relationships are worth a deliberate experiment, not in declaring a law.
How sleep signals connect to lift output
Sleep doesn't move your bench press directly the way an extra plate does. It works through recovery. Poor or inconsistent sleep tends to suppress next-day HRV and recovery, and lower recovery is the day your nervous system has less to give. Over enough sessions, that can show up as flatter top sets, lower volume tolerance, or sessions that feel harder for the same load.
But "tends to" is doing real work in that sentence. The only way to find out whether it holds for you is to put your sleep inputs, your recovery, and your actual lift output side by side and look. That's exactly the question of whether recovery predicts your lift output — and it's a question you can only answer with your own joined data, not a population average.
No driver view in WHOOP alone? → Join your sleep and lift data automatically
How it works
From Two Disconnected Streams to One Driver View
- WHOOP recovery & sleep pulled in via the WHOOP API — recovery, HRV, sleep efficiency, time in bed, bedtime
- Strength Trainer lifts added by screenshot — AI extracts your sets, reps and weights via OCR
- Joined by date so each training day carries its own sleep and recovery context
- Driver analysis ranks which sleep signal tracks most strongly with your recovery and output, with sample size and correlation shown
No more guessing which metric matters. You see the relationships that exist in your own data, stated plainly.
Connect WHOOP and your lifts →What WHOOP shows vs. what StrengthInsight adds
WHOOP owns the measurement. StrengthInsight adds the connection layer — joining those measurements to your output and surfacing the drivers. Here's the direct comparison:
| Capability | WHOOP | StrengthInsight |
|---|---|---|
| Bedtime, time in bed, sleep efficiency tracking | ✓ Yes | ✓ Pulled via API |
| Recovery score & HRV | ✓ Yes | ✓ Shown beside lifts |
| Strength Trainer session logging | ✓ Yes | ✓ From screenshots |
| Sleep signals joined to lift output by date | ✗ No | ✓ Yes |
| Driver analysis (which sleep metric matters most) | ✗ No | ✓ Ranked with correlation |
| Sample size & correlation strength shown | ✗ No | ✓ On every insight |
| Individual-to-you findings | ✗ No | ✓ Your own data only |
The point isn't that WHOOP is missing data — it's that the data is sitting unused. StrengthInsight reads the same sleep metrics WHOOP already records and finally lines them up against what you lifted.
Turning the signals into something you can act on
Once you can see which sleep input is your strongest driver, the response is simple and concrete. Three things are worth doing regardless of what your data says, because they're the levers most likely to move:
- Anchor a consistent bedtime. Pick a target window and hold it within roughly 30 minutes, weekends included. If bedtime variability turns out to be your HRV driver, this is the single highest-leverage change you can make — and you'll see it land in your recovery data.
- Protect time in bed. Efficiency can't compensate for a window that's too short. Give yourself enough time in bed first; if it's your sleep-efficiency driver, lengthening that window tends to lift the whole night.
- Then watch the training data respond. Make one change, keep everything else steady, and let 3–4 weeks of matched days accumulate. The trend across those weeks is far more reliable than any single night or session.
This is also where sleep meets the mechanical side of progress. A cleaner sleep routine that lifts your recovery should, over a block, show up in your estimated 1RM trend — and seeing both the sleep input and the strength output in one place is what lets you tell a genuine response from random noise.
None of this requires a perfect routine or a lab. It requires the two data streams WHOOP already collects to finally be joined and analysed together, so the relationships stop being guesses.
How much data you need before it means anything
A driver analysis is only as trustworthy as the matched days behind it. A correlation drawn from 8 nights is mostly noise; one drawn from 50+ matched days is something you can reason about. This is why sample size sits on every StrengthInsight insight — a strong correlation on a small sample is a hint, not a finding.
For most lifters wearing WHOOP nightly and training 3–4 days a week, four to six weeks of consistent uploads gets you to a point where the driver rankings stabilise. Before that, treat early results as directional. After it, the patterns that hold are worth building a routine around. The work is no harder than wearing the band you already wear and uploading a few screenshots — the analysis is the part that was missing.
😴 Stop letting your sleep data sit unused
See which sleep signal actually moves your training data
Connect WHOOP recovery and sleep, add a few Strength Trainer screenshots, and StrengthInsight joins them by date — then shows you the strongest driver of your recovery and output, with the sample size and correlation behind it. Free to start.
Try StrengthInsight →